With rasterio geometry_mask
Rasterix includes a dask-aware wrapper of rasterio.features.geometry_mask and rioxarray’s geometry_clip
Read data
Read in some raster data
import xarray as xr
import xproj  # noqa

ds = xr.tutorial.open_dataset("eraint_uvz")[["u"]]
ds = ds.proj.assign_crs(spatial_ref="epsg:4326")
ds
/home/docs/checkouts/readthedocs.org/user_builds/rasterix/envs/latest/lib/python3.12/site-packages/xarray/conventions.py:205: SerializationWarning: variable 'z' has non-conforming '_FillValue' np.float64(nan) defined, dropping '_FillValue' entirely.
  var = coder.decode(var, name=name)
/home/docs/checkouts/readthedocs.org/user_builds/rasterix/envs/latest/lib/python3.12/site-packages/xarray/conventions.py:205: SerializationWarning: variable 'u' has non-conforming '_FillValue' np.float64(nan) defined, dropping '_FillValue' entirely.
  var = coder.decode(var, name=name)
/home/docs/checkouts/readthedocs.org/user_builds/rasterix/envs/latest/lib/python3.12/site-packages/xarray/conventions.py:205: SerializationWarning: variable 'v' has non-conforming '_FillValue' np.float64(nan) defined, dropping '_FillValue' entirely.
  var = coder.decode(var, name=name)
<xarray.Dataset> Size: 6MB
Dimensions:      (month: 2, level: 3, latitude: 241, longitude: 480)
Coordinates:
  * month        (month) int32 8B 1 7
  * level        (level) int32 12B 200 500 850
  * latitude     (latitude) float32 964B 90.0 89.25 88.5 ... -88.5 -89.25 -90.0
  * longitude    (longitude) float32 2kB -180.0 -179.2 -178.5 ... 178.5 179.2
  * spatial_ref  int64 8B 0
Data variables:
    u            (month, level, latitude, longitude) float64 6MB ...
Indexes:
    spatial_ref  CRSIndex (crs=EPSG:4326)
Attributes:
    Conventions:  CF-1.0
Info: Monthly ERA-Interim data. Downloaded and edited by fabien.m...Read in example geometries
import geodatasets
import geopandas as gpd

world = gpd.read_file(geodatasets.get_path("naturalearth land"))
asia = world.iloc[slice(112, 113)]
asia
| featurecla | scalerank | min_zoom | geometry | |
|---|---|---|---|---|
| 112 | Land | 0 | 0.0 | POLYGON ((106.97028 76.9743, 107.24011 76.4801... |
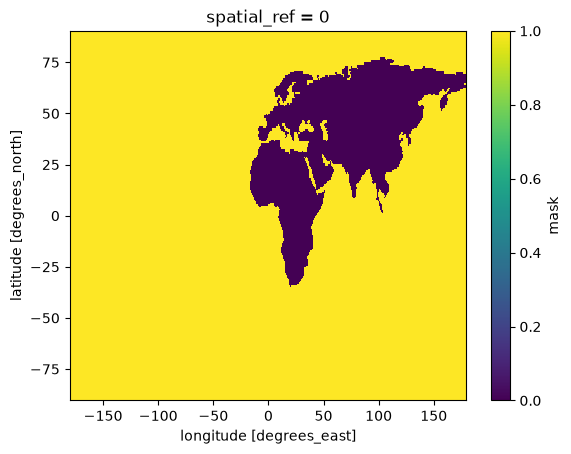
from rasterix.rasterize import geometry_mask

geometry_mask(ds, asia[["geometry"]], xdim="longitude", ydim="latitude").plot()
<matplotlib.collections.QuadMesh at 0x79bea992f440>
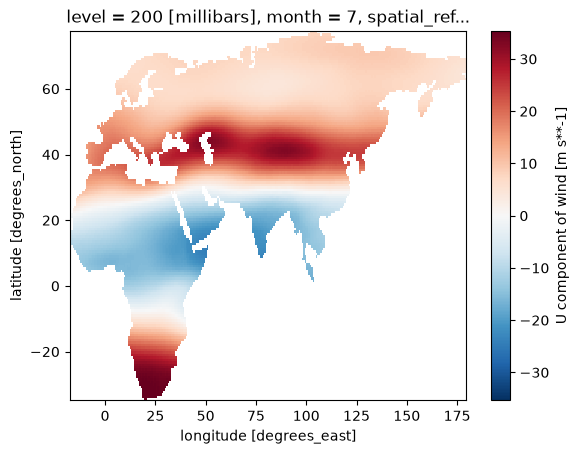
By default, geometry_clip clips to the total_bounds of the provided geometries
from rasterix.rasterize import geometry_clip

n = geometry_clip(ds, asia[["geometry"]], xdim="longitude", ydim="latitude")
n.u.isel(month=1, level=0).plot()
<matplotlib.collections.QuadMesh at 0x79bea99a9310>
Out-of-core support
All combinations of chunked and in-memory arrays and geometries are supported.
dask.array + geopandas
chunked = ds.chunk({"latitude": -1, "longitude": 120})
d = geometry_clip(chunked, asia[["geometry"]], xdim="longitude", ydim="latitude")
d
<xarray.Dataset> Size: 2MB
Dimensions:      (month: 2, level: 3, latitude: 150, longitude: 263)
Coordinates:
  * month        (month) int32 8B 1 7
  * level        (level) int32 12B 200 500 850
  * latitude     (latitude) float32 600B 77.25 76.5 75.75 ... -33.0 -33.75 -34.5
  * longitude    (longitude) float32 1kB -17.25 -16.5 -15.75 ... 178.5 179.2
  * spatial_ref  int64 8B 0
Data variables:
    u            (month, level, latitude, longitude) float64 2MB dask.array<chunksize=(2, 3, 150, 23), meta=np.ndarray>
Indexes:
    spatial_ref  CRSIndex (crs=EPSG:4326)
Attributes:
    Conventions:  CF-1.0
Info: Monthly ERA-Interim data. Downloaded and edited by fabien.m...dask.array + dask-geopandas
import dask_geopandas as dgpd
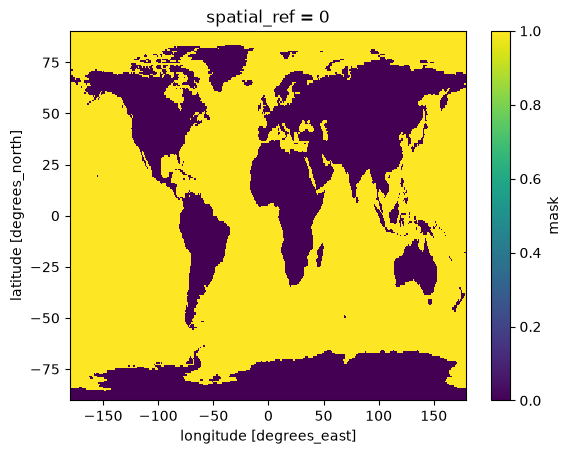
dd = geometry_mask(
ds.chunk({"latitude": -1, "longitude": 240}),
dgpd.from_geopandas(world[["geometry"]], npartitions=3),
xdim="longitude",
ydim="latitude",
)
dd
<xarray.DataArray 'mask' (latitude: 241, longitude: 480)> Size: 116kB
dask.array<all-aggregate, shape=(241, 480), dtype=bool, chunksize=(241, 240), chunktype=numpy.ndarray>
Coordinates:
  * latitude     (latitude) float32 964B 90.0 89.25 88.5 ... -88.5 -89.25 -90.0
  * longitude    (longitude) float32 2kB -180.0 -179.2 -178.5 ... 178.5 179.2
spatial_ref int64 8B 0dd.plot()
<matplotlib.collections.QuadMesh at 0x79bea07f4170>