Zonal stats along line segments
This quick example shows off using rasterize(), and Xarray’s GroupBy to do zonal stats along a line.
import numpy as np
import pyproj
import shapely
import xarray as xr

ds = xr.Dataset(
    coords={
        "spatial_ref": (
            (),
            0,
            pyproj.CRS.from_epsg(3035).to_cf() | {"GeoTransform": "100000 12000 0 60000 0 -12000"},
        )
    },
)
ds["foo"] = xr.DataArray(
    np.random.default_rng(0).integers(0, 256, size=(100, 200), dtype=np.uint8),
    dims=("y", "x"),
)
ds
<xarray.Dataset> Size: 20kB
Dimensions:      (y: 100, x: 200)
Coordinates:
    spatial_ref  int64 8B 0
Dimensions without coordinates: y, x
Data variables:
foo (y, x) uint8 20kB 95 130 194 217 207 235 ... 155 69 155 2 28 23Generate coordinates with RasterIndex
We’ll use assign_index() to assign lazy coordinate locations in x and y.
import rasterix

ds = rasterix.assign_index(ds)
ds
<xarray.Dataset> Size: 22kB
Dimensions:      (y: 100, x: 200)
Coordinates:
  * y            (y) float64 800B 5.4e+04 4.2e+04 ... -1.122e+06 -1.134e+06
  * x            (x) float64 2kB 1.06e+05 1.18e+05 ... 2.482e+06 2.494e+06
    spatial_ref  int64 8B 0
Data variables:
    foo          (y, x) uint8 20kB 95 130 194 217 207 235 ... 155 69 155 2 28 23
Indexes:
  ┌ x        RasterIndex (crs=None)
└ yMake a geometry
We will take a LineString and split it in to 80km segments.
For simplicity the line will extend from the top-left corner to the bottom-right corner.
import geopandas as gpd

from rasterix.rasterize import rasterize

# make a diagonal line across the raster
line = gpd.GeoDataFrame(
    {
        "geometry": [
            shapely.LineString(
                [
                    [ds.x[0].item(), ds.y[0].item()],
                    [ds.x[-1].item(), ds.y[-1].item()],
                ]
            )
        ]
    }
)
# 80km segments
line = line.segmentize(80_000)
coords = shapely.get_coordinates(line)
segment_coords = np.stack([coords[:-1], coords[1:]], axis=1)  # shape (n-1, 2, 2)
segments = shapely.linestrings(segment_coords)
geoms = gpd.GeoDataFrame({"geometry": segments})
geoms
| geometry | |
|---|---|
| 0 | LINESTRING (106000 54000, 176235.294 19058.824) |
| 1 | LINESTRING (176235.294 19058.824, 246470.588 -... |
| 2 | LINESTRING (246470.588 -15882.353, 316705.882 ... |
| 3 | LINESTRING (316705.882 -50823.529, 386941.176 ... |
| 4 | LINESTRING (386941.176 -85764.706, 457176.471 ... |
| 5 | LINESTRING (457176.471 -120705.882, 527411.765... |
| 6 | LINESTRING (527411.765 -155647.059, 597647.059... |
| 7 | LINESTRING (597647.059 -190588.235, 667882.353... |
| 8 | LINESTRING (667882.353 -225529.412, 738117.647... |
| 9 | LINESTRING (738117.647 -260470.588, 808352.941... |
| 10 | LINESTRING (808352.941 -295411.765, 878588.235... |
| 11 | LINESTRING (878588.235 -330352.941, 948823.529... |
| 12 | LINESTRING (948823.529 -365294.118, 1019058.82... |
| 13 | LINESTRING (1019058.824 -400235.294, 1089294.1... |
| 14 | LINESTRING (1089294.118 -435176.471, 1159529.4... |
| 15 | LINESTRING (1159529.412 -470117.647, 1229764.7... |
| 16 | LINESTRING (1229764.706 -505058.824, 1300000 -... |
| 17 | LINESTRING (1300000 -540000, 1370235.294 -5749... |
| 18 | LINESTRING (1370235.294 -574941.176, 1440470.5... |
| 19 | LINESTRING (1440470.588 -609882.353, 1510705.8... |
| 20 | LINESTRING (1510705.882 -644823.529, 1580941.1... |
| 21 | LINESTRING (1580941.176 -679764.706, 1651176.4... |
| 22 | LINESTRING (1651176.471 -714705.882, 1721411.7... |
| 23 | LINESTRING (1721411.765 -749647.059, 1791647.0... |
| 24 | LINESTRING (1791647.059 -784588.235, 1861882.3... |
| 25 | LINESTRING (1861882.353 -819529.412, 1932117.6... |
| 26 | LINESTRING (1932117.647 -854470.588, 2002352.9... |
| 27 | LINESTRING (2002352.941 -889411.765, 2072588.2... |
| 28 | LINESTRING (2072588.235 -924352.941, 2142823.5... |
| 29 | LINESTRING (2142823.529 -959294.118, 2213058.8... |
| 30 | LINESTRING (2213058.824 -994235.294, 2283294.1... |
| 31 | LINESTRING (2283294.118 -1029176.471, 2353529.... |
| 32 | LINESTRING (2353529.412 -1064117.647, 2423764.... |
| 33 | LINESTRING (2423764.706 -1099058.824, 2494000 ... |
Rasterize the geometries
res = (
    rasterize(
        ds,
        geoms,
        all_touched=True,
        engine="rusterize",
    )
    .compute()
    .rename("segment")
)
res
<xarray.DataArray 'segment' (y: 100, x: 200)> Size: 20kB
array([[ 0,  0, 34, ..., 34, 34, 34],
       [34,  0,  0, ..., 34, 34, 34],
       [34, 34, 34, ..., 34, 34, 34],
       ...,
       [34, 34, 34, ..., 34, 34, 34],
       [34, 34, 34, ..., 33, 33, 34],
       [34, 34, 34, ..., 34, 33, 33]], shape=(100, 200), dtype=uint8)
Coordinates:
  * y            (y) float64 800B 5.4e+04 4.2e+04 ... -1.122e+06 -1.134e+06
  * x            (x) float64 2kB 1.06e+05 1.18e+05 ... 2.482e+06 2.494e+06
    spatial_ref  int64 8B 0
Indexes:
  ┌ x        RasterIndex (crs=None)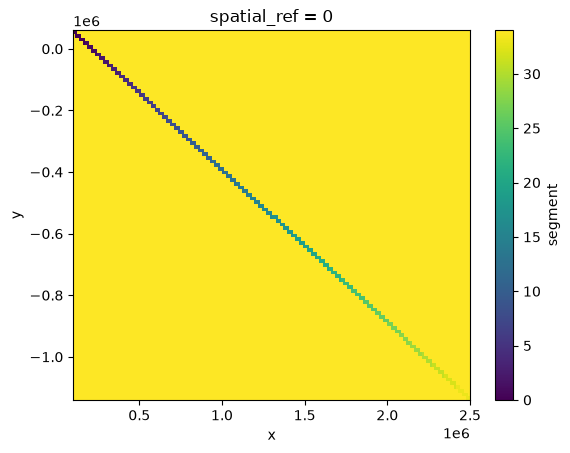
└ yres.plot()
<matplotlib.collections.QuadMesh at 0x710ecf8b6090>
Zonal stats with Xarray’s GroupBy
(faster when powered by flox!)
zonal = ds["foo"].groupby(res).max()
# drop the last segment (background/NaN pixels)
zonal = zonal.isel(segment=slice(-1))
zonal
<xarray.DataArray 'foo' (segment: 34)> Size: 34B
array([200, 219, 250, 217, 185, 241, 241, 213, 245, 237, 238, 253, 227,
       253, 253, 245, 234, 255, 242, 225, 206, 236, 229, 232, 215, 234,
       249, 212, 242, 238, 153, 178, 237, 243], dtype=uint8)
Coordinates:
  * segment      (segment) uint8 34B 0 1 2 3 4 5 6 7 ... 26 27 28 29 30 31 32 33
spatial_ref int64 8B 0Make a vector data cube with Xvec
import xvec # noqa: F401
zonal = zonal.assign_coords(segment=geoms["geometry"])
zonal = zonal.xvec.set_geom_indexes("segment", crs=3035)
zonal
<xarray.DataArray 'foo' (segment: 34)> Size: 34B
array([200, 219, 250, 217, 185, 241, 241, 213, 245, 237, 238, 253, 227,
       253, 253, 245, 234, 255, 242, 225, 206, 236, 229, 232, 215, 234,
       249, 212, 242, 238, 153, 178, 237, 243], dtype=uint8)
Coordinates:
* segment (segment) geometry 272B LINESTRING (106000 54000, 176235.294...
spatial_ref int64 8B 0
Indexes:
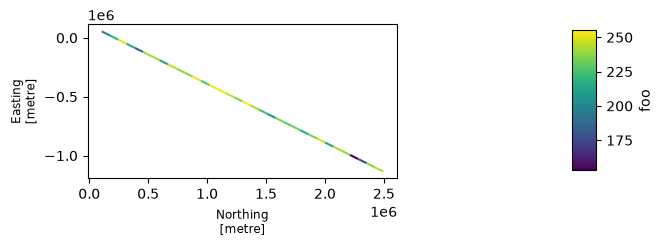
segment GeometryIndex (crs=EPSG:3035)Plot
f, ax = zonal.xvec.plot()
f.set_size_inches((8, 2))